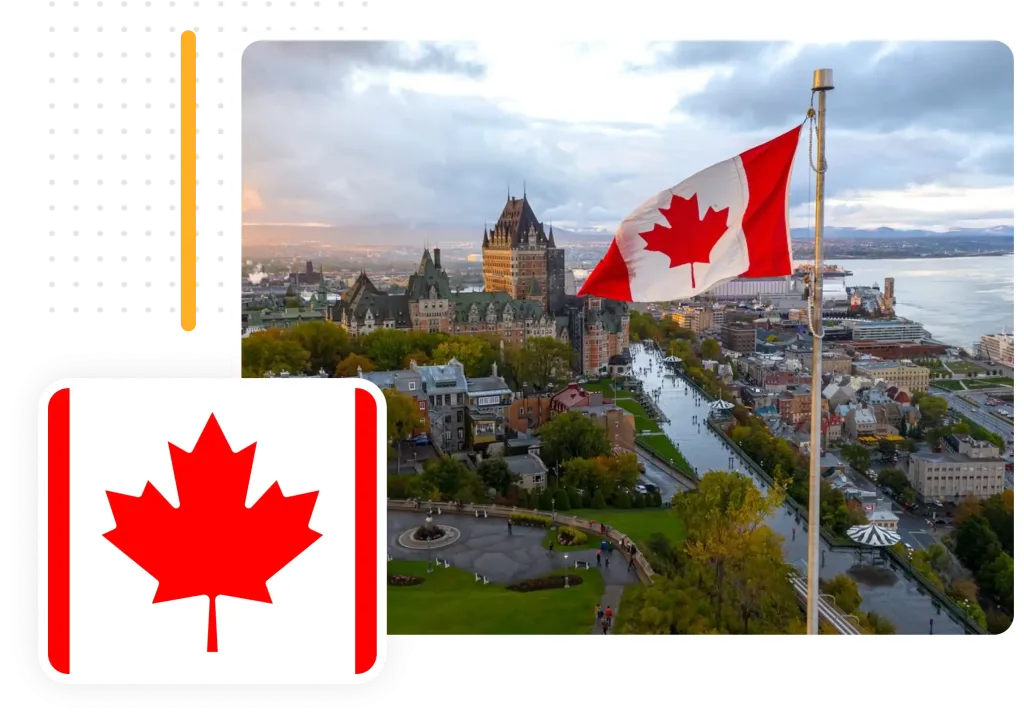
Canada
The Land of Stunning Natural Beauty

What We Are Offering
About Canada
$275,000
Minimum Investment
36 – 37
Months Processing Time
Benefit of Canada Residency
Join an Affordable Program
The Canada Start-Up Visa (SUV) Program offers a more cost-effective option compared to the former Quebec Immigrant Investor Program. Additionally, it provides quicker processing times, allowing you to settle in Canada sooner. Contact us today to discuss your goals and find the perfect investment fit for your journey to Canadian residency.
Pathway to Canadian Citizenship
You and your family can apply for Canadian citizenship if you reside in Canada for three years within the last five years. You must also demonstrate proficiency in English and/or French and maintain a clean criminal record. Contact us today to discuss your goals and find the perfect investment fit for your journey to Canadian residency.
Enjoy Free Universal Healthcare
Canada's public healthcare system is funded by taxes paid by citizens and Permanent Residents, providing free universal healthcare access. Contact us today to discuss your goals and find the perfect investment fit for your journey to Canadian residency.
Leverage Abundant Natural Resources
Canada boasts the world’s second-largest oil reserves and the fourth-largest supply of fresh water, offering vast opportunities and resources. Contact us today to discuss your goals and find the perfect investment fit for your journey to Canadian residency.
Who Could be Included
Who Can Get Canada Residency


- Age: Must be over 18 years old
- Business Ownership: Must own a qualifying business
- Security Clearance: Must gain security clearance
- Medical Examination: Must pass the medical examination
- Age: Must be over 18 years old
- Security Clearance: Must gain security clearance
- Medical Examination: Must pass the medical examination
- Age: Must be under 22 years old
- Marital Status: Must be unmarried
- Examinations: Must pass both medical and security examinations
- Ensure that your mentally and physically disadvantaged children and stepchildren receive the necessary support and care, with access to Canada’s comprehensive healthcare and social services.
- Include your parents, grandparents, parents-in-law, and grandparents-in-law in your application, offering them the opportunity to enjoy the peaceful and high-quality lifestyle that Canada has to offer.
- Add your siblings, brothers-in-law, and sisters-in-law to your residency application, allowing them to benefit from Canada’s welcoming and prosperous environment.
- Plan for the future by including provisions for your future spouse in your residency application, ensuring they too can enjoy the benefits of Canadian residency and its numerous opportunities.
Program Requirements
Contact us today to discuss your goals and find the perfect investment fit for your journey to Residency.
OPTION 1: Invest in a Venture Capital Fund
Make a C$325,000 investment in a Canadian Venture Capital Fund. This investment secures a 10% shareholding in a new Canadian start-up and includes additional investments in other start-ups. The package also covers initial due diligence, onboarding, corporate legal, professional, advisory, membership, and incubation fees.
OPTION 2: Become an Accredited Investor
Invest C$275,000 through an Angel Investors Group. This option grants a 10% shareholding in a new Canadian start-up and includes investments in additional start-ups. It also covers initial due diligence, onboarding, corporate legal, professional, advisory, membership, and incubation fees.
OPTION 3: Invest in an Angel Investors Group
Contribute C$275,000 to an Angel Investors Group. This investment option includes a 10% shareholding in a new Canadian start-up and investments in other start-ups. The package also covers initial due diligence, onboarding, corporate legal, professional, advisory, membership, and incubation fees.
Additional Requirements and Benefits
Applicants for the Canada SUV Program must demonstrate proficiency in English or French at a Canadian Language Benchmark (CLB) level of 5. Additionally, they must prove their net worth and bring sufficient funds to settle in Canada. For instance, a single applicant must have at least C$13,310 in disposable funds, while a family of four requires C$24,733. Canada's high safety standards make it an ideal place to raise a family.
Common Questions
Uncertain about Residency by Investment? We've got you Covered.
The typical processing time for applications to the Canada Start-Up Visa (SUV) Program is approximately 36 to 37 months, provided there are no complications.
The minimum investment required for this Residency by Investment program is C$275,000.
Taxation in Canada involves federal and provincial levels, and residents are taxed on their worldwide income. Non-residents, however, are taxed only on Canadian-sourced income and gains from the sale of taxable Canadian property. A person is considered a resident if they live in Canada or are ordinarily a resident. Non-residents who spend 183 days or more in Canada within a calendar year are also deemed residents for tax purposes. The provincial income tax rates are determined separately and added to the federal rates. Capital gains are taxed at a reduced rate of 50% of the gains, minus allowable capital losses.

Latest Articles
Greece
© Borders & Gates 2024. All Rights Reserved


